Global Standard

1. Average Wait Time
The Average Wait Time (AWT) is an important metric that measures the average time customers spend waiting on hold for an agent. A long wait time may lead to a poor customer satisfaction score.
Here’s how you can calculate AWT:

While there may be valid reasons for putting a customer on hold, your customer service executives should ensure they keep the waiting time to a minimum.
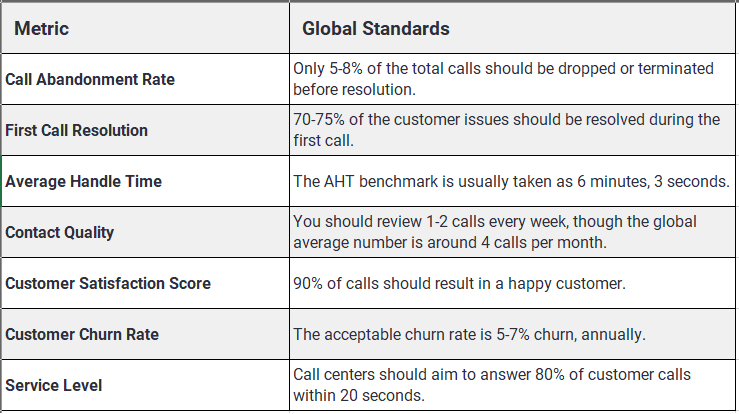
2. Call Abandonment Rate
In an inbound call centre, the Call Abandonment Rate (CAR) refers to the number of calls where the customer hangs up before your agent answers the call.
Dropped calls may be directly related to long wait times.
Here’s the formula to calculate the abandon rate:

You can reduce your call abandonment rate by ensuring you have enough agents during peak periods, offering self-service options to customers to reduce the incoming calls, etc.
An abandoned call could mean a frustrated customer, who may potentially lose trust in your brand. However, some dropped calls may be due to poor network, customer’s other engagements, etc.
3. Average Call Transfer
The Average Call Transfer (ACT) rate is a critical call center metric determining the number of customer calls transferred to other departments, supervisors, etc.
Here’s how you can calculate the transfer rates:

While most of these transfers are necessary for better resolution of the customer requests, customers generally aren’t too pleased with them. That’s why you should aim to keep them to a minimum.
You can greatly reduce the need for transferring calls by ensuring that your IVR system (Interactive Voice Response system) is easy to navigate and clearly describes each department.
You should also focus on agent training and skill-building so that they can better handle customer queries.
4. First Call Resolution
The First Call Resolution (FCR) rate shows the successful resolution of a customer’s problem within their first call to your call centre.
This important metric significantly contributes towards enhancing your customer relationships and their level of satisfaction.
You can calculate FCR using the following formula:

Note: The call centre managers and agents decide the definition of resolution of an issue.
Customer requests like reservation changes, bookings, cancellations, etc., that usually don’t require repeat calls are considered to calculate FCR.
Call centres across industries consider FCR as a Key Performance Indicator (KPI) that indicates customer satisfaction levels.
5. Average Handle Time
The Average Handle Time (AHT) is the average number of minutes an agent takes to handle a call from the beginning till the end. It includes the customer’s hold time during the call and the agent’s after-call work time.
Here’s the formula to calculate the AHT:

It’s important to note that a low AHT isn’t always desirable.
Sometimes, your agent’s AHT may go beyond the set standard because they needed time to resolve a query from an angry customer.
7. Customer Satisfaction Score
The Customer Satisfaction Score (CSAT) is a great indicator of how happy the customer is with your brand as a whole.
Generally, companies ask customers to provide feedback on how satisfied they are with the agent’s resolution of their issue.
Usually, they can rate their feedback as:
- Very Satisfied.
- Satisfied.
- Not Satisfied.
- Very Unsatisfied.
You can then calculate the average CSAT score with the following formula:

If you want to improve your CSAT score, you need to ensure that your call centre agents are well-trained and meet or exceed the standards for other metrics like AHT, FCR, etc.
CSAT is also directly related to the Net Promoter Score, since the better your customer satisfaction, the more likely they are to promote your brand.
8. Net Promoter Score
Net Promoter Score (NPS) is a popular market research metric that tells how many loyal customers you have.
Customers generally rate the brand on a scale of 0-10, where:
- 9-10 are promoters.
- 7-8 are passives.
- 0-6 are detractors.
Based on this classification, the formula for calculating the NPS is:

It can help you determine whether your brand’s customer experience results in customer satisfaction. If it doesn’t, you need to find out the areas which can be improved and reallocate your resources and finances in that direction.
9. Customer Retention Rate
The Customer Retention Rate (CRR) refers to the percentage of existing active customers who remain a part of your pool of customers within a specific time frame.
Here’s the formula to calculate the CRR:

To increase the retention rate, your call centre should have a specialized customer retention team that can handle any complicated customer issue.
10. Customer Churn Rate
The Customer Churn Rate (CCR) calculates the percentage of customers that stopped using your brand in a given period of time.
The formula for calculating CCR is:

Since CRR and CCR go hand in hand, the strategies you adapt to increase your retention rate can automatically reduce your churn rate.
11. Average After-Call Work Time
The Average After-Call Work Time metric measures the time taken by an agent to complete all call-related work. These tasks may include taking notes, filling out forms, entering customer information, etc.
You can calculate it using the following formula:

A higher average time spent on after-call work may indicate an inefficiency among agents, call center tools, or workflows.
Monitoring agent productivity, creating templates for routine tasks, and eliminating unnecessary steps in the workflow may help to reduce the time.
12. Cost Per Contact
The Cost Per Contact (CPC) refers to the average cost a call centre has to incur for every call it handles. It indicates the total cost of running a call centre, including wages, incentives, software and hardware costs, etc.
Let’s look at the formula for calculating the CPC:

The metric also offers insights into the call centre’s operational efficiency — whether you’re allocating your resources appropriately and cost-effectively.
13. Service Level
The Service Level metric is a reliable indicator of your call center’s performance and may also indicate the level of customer satisfaction. It’s usually based on the average speed of answer.
There are three different formulas to calculate a call centre’s service level, depending on how you consider the abandoned calls — whether it’s a missed opportunity, ignored, or counted.
Here are the three formulas:
Note: Here, Y seconds is the predetermined threshold or the minimum time within which an agent should attend customer calls.
a. When abandoned calls are considered as a missed opportunity

b. When abandoned calls are ignored

c. When abandoned calls are counted

You can improve your service levels by:
- Training your call centre agents.
- Improving operational efficiency.
- Upgrading your call centre technology.
14. Agent Schedule Adherence
Agent Schedule Adherence is a metric that determines whether agents are working within their set schedules.
You can calculate the schedule adherence using the following formula:

Adherence to the schedule and minimal agent absenteeism ensures a smooth transition between agents’ shifts. This can reduce the number of missed calls or abandoned calls and enhance the call centre’s service level.
A comprehensive workforce management tool like Time Doctor can assist you in calculating this metric by accurately tracking the login time, break time, etc. The tool also tracks attendance and monitors agent productivity.
15. Agent Attrition Rate
The Agent Attrition Rate is an indicator of agent turnover. It’s a metric that demonstrates the pace at which your agents resign or retire.
Here’s how you can calculate it:

A high attrition rate increases your operational costs and can also reduce your call centre’s ability to serve your customers efficiently and satisfactorily.
A great way to reduce agent attrition is by promoting an employee-centric work environment that makes them feel valued and increases their engagement and job satisfaction.
Additionally, conducting exit interviews can provide honest insights into workplace issues and enable you to take measures to prevent these issues from reoccurring.